

Sales today
Live answerSales are up 14% today, driven mostly by returning customers and higher average order value. Margin is holding steady.
The always-on analyst that never stops watching your business. Foxy monitors your store, customers, products, ads, inventory, and margins 24/7. It finds what changed, explains why it likely happened, and suggests what to do next.
How can I help you today?
Sales are up 14% today, driven mostly by returning customers and higher average order value. Margin is holding steady.
Get your answer in seconds. Foxy connects revenue, customers, products, ads, inventory, and margins so you can understand what changed without building another report.
Most tools only see one piece. Foxy combines store, customers, products, ads, inventory, shipping, returns, payments, reviews, and support.

 Shopify
 Stripe
 GA4
GA4
 Meta Ads
 Klaviyo
 Support
 Inventory
 Reviews
Pick what you need to investigate. Foxy changes the visual, compares the evidence, and turns the question into an answer.
Foxy compares sales, conversion, returning buyers, shipping, margin, and product feedback before answering.
Skip the tool-hopping and report setup. Foxy prepares the data and gives you the answer, evidence, and next move.
 No DashboardsAsk naturally instead of rebuilding views.

 No SQL.Foxy handles the joins and filters.
 No report builders.Get the story without formatting charts.
 Just AskGet answers, evidence, and recommendations.

Connect the tools you already run, let Foxy organise what they hold, then ask in plain language and follow the evidence.
Connect Shopify, WooCommerce, GA4, ads, email, inventory, shipping, and other business systems.
Foxy prepares the data so it can compare, filter, group, investigate, and reason across sources.
Use natural language. Ask a question, follow up, and dig deeper into the answer.
Foxy watches the business continuously and alerts you when something important changes.
Export your analysis and take it to the meeting with you.
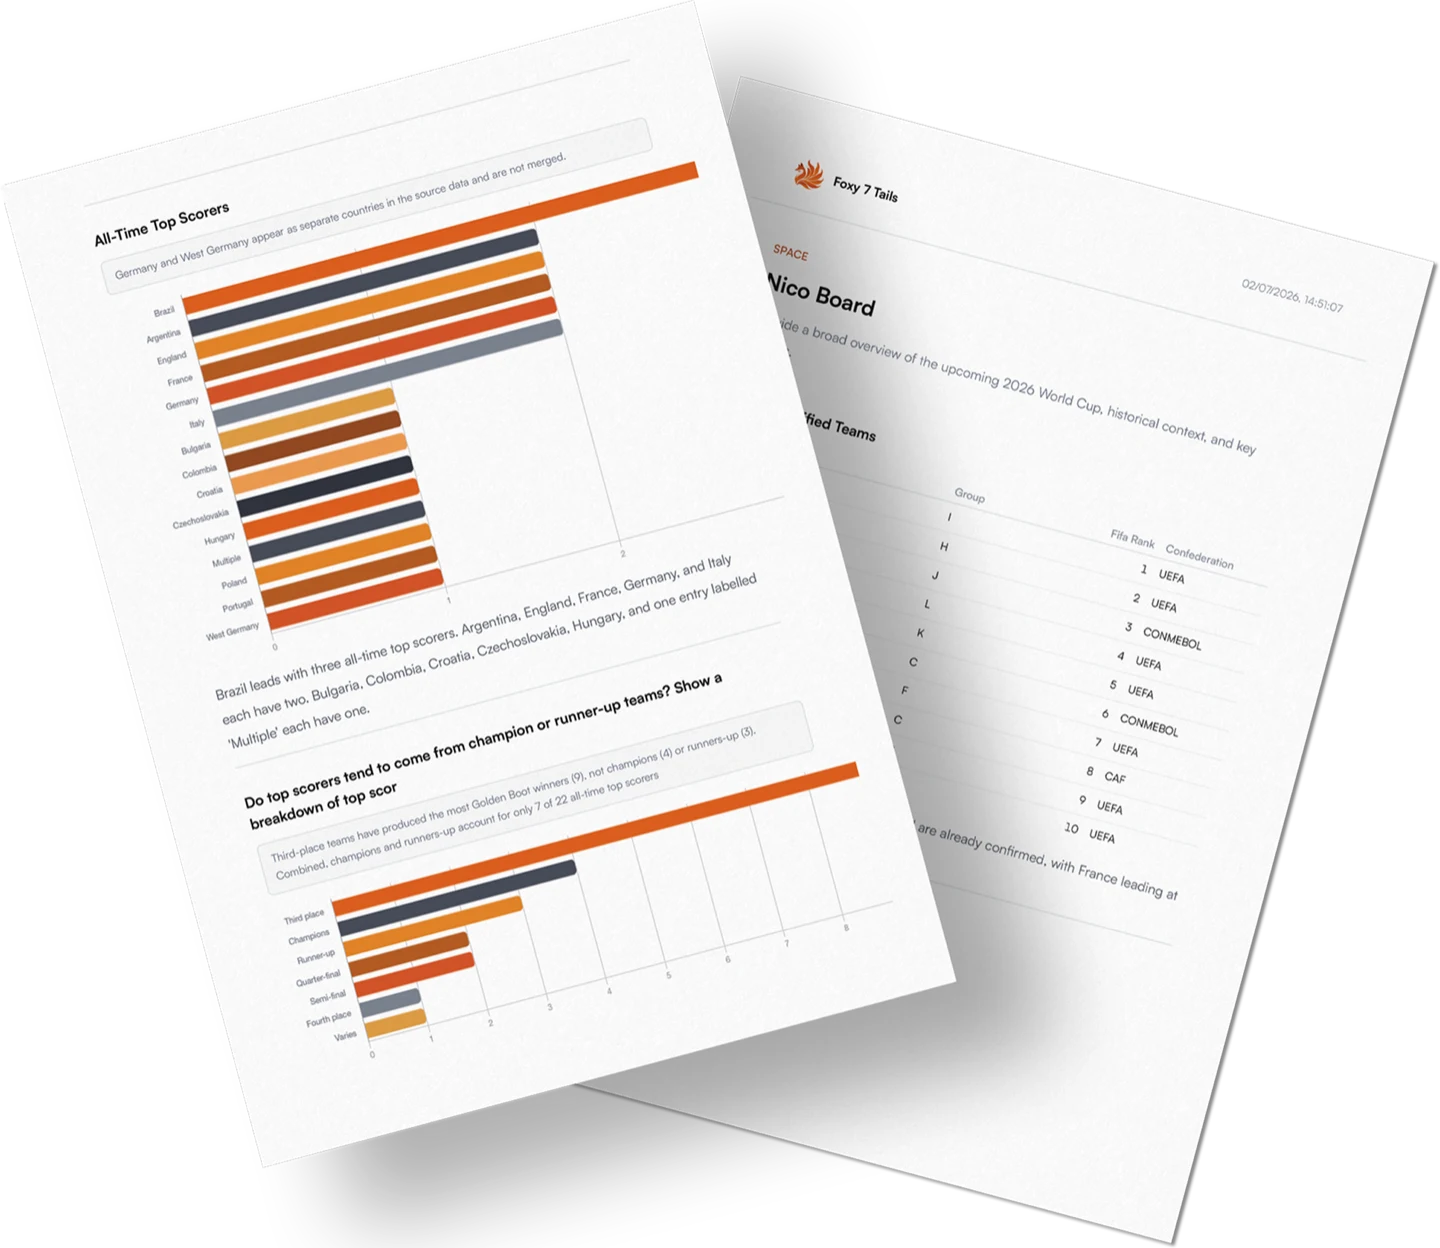
How Foxy connects to the business, finds the cause, and carries the answer into the next decision.
Revenue, customers, products, advertising, inventory, margins, shipping, returns, payments, reviews, support, and the relationships between them.
A dashboard shows the metric. Foxy investigates what changed, compares the evidence across sources, explains the likely cause, and suggests the next move.
Yes. Foxy watches continuously and surfaces meaningful changes in revenue, margin, inventory, and customer behavior without waiting for a question.
Founders, operators, marketing teams, finance teams, and e-commerce brands that need cross-tool answers without building another report.
Join the beta, connect the tools that matter, and ask a real business question. We will help early teams with setup and integrations.
See how one question becomes evidence, explanation, and a useful next move.